- Child Nutrition Indicators improves between National Family Health Survey 4 (2015-2016) and National Family Health Survey 5 (2019-2021)
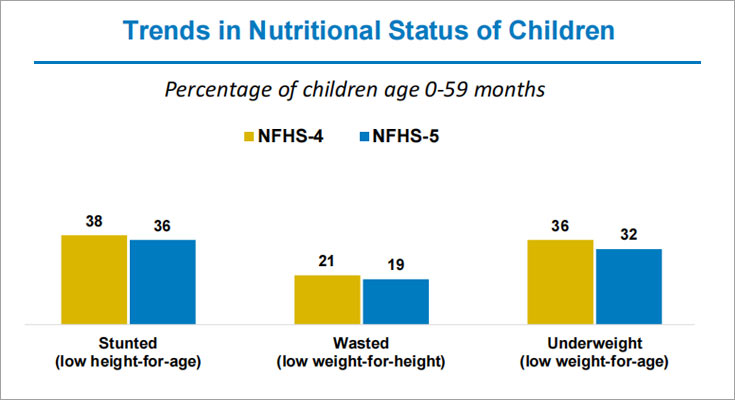
- The prevalence of Stunting has reduced from 38.4% to 35.5%, Wasting from 21.0% to 19.3% and Underweight from 35.8% to 32.1%
- Acute Malnutrition in children under the age of 5 worsened
National Family Health Survey (NFHS-5)
Go to source). Several indicators of child’s nutrition such as stunting (low height-for-age), wasting (low weight-for-height) and underweight (low weight-for-age) are calculated by NFHS.
Read More..
Trends According to NFHS-5
The key findings were -- 36 percent of children under age five are stunted (short for their age);
- 19 percent are wasted (thin for their height);
- 32 percent are underweight (thin for their age);
- 3 percent are overweight (heavy for their height).
- Children born to mothers with no schooling and children in the lowest wealth quintile are most likely to be undernourished.
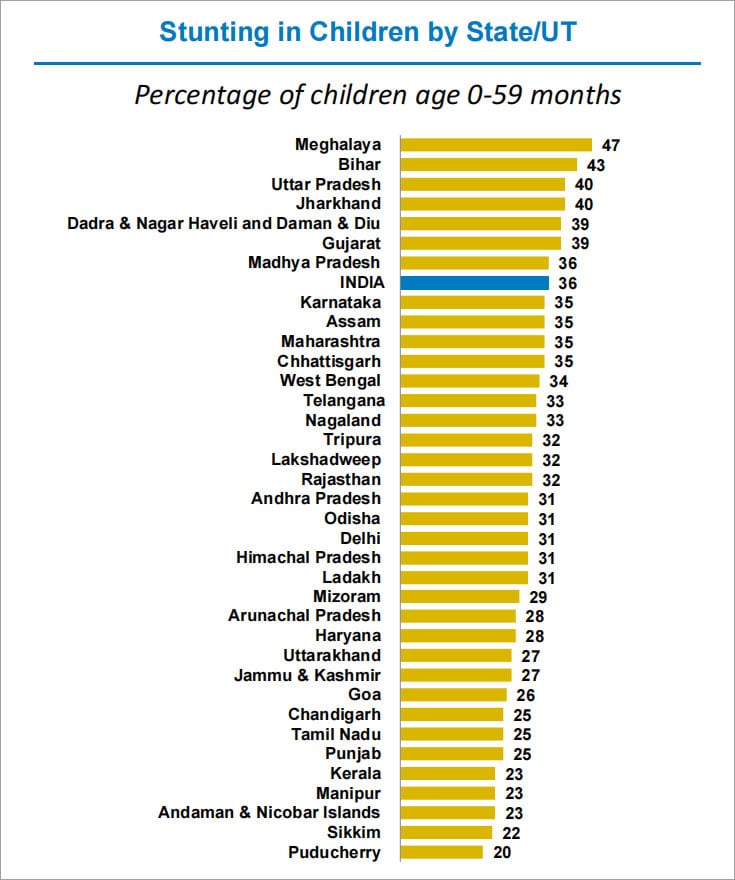
37.3% of the children that are stunted live in rural areas, compared to 30.1% in urban areas. Meghalaya (46.5%), Bihar (42.9%), Uttar Pradesh (39.7%), and Jharkhand (39.6%) have the highest rates of stunting, while Sikkim (22.3%) and Pondicherry (20%) have the lowest rates, according to the state wise data.
Goa (from 20.1% to 25.8%) and Kerala (from 19.7% to 23.4%) had the lowest rates of childhood stunting in the NFHS-4 (2015–16), but these rates significantly increased in the NFHS-5.
The extent of wasting, 10 of the 21 states and union territories have reversed on the parameter, and the numbers are more in line with NFHS-3 levels (2005-06). Nagaland and the union territories of Jammu and Kashmir saw a gain of 6%.
Karnataka was the top-performing state, with a decrease from 26.1% to 19.5%. Meghalaya and Goa both saw improvements over the previous survey. All five union territories and 11 states saw an increase in the number of underweight children. There was only a slight to moderate reduction in the levels in Bihar, Gujarat, and a few Northeastern (NE) states.
However, the percentage of underweight children increased by approximately 3% in wealthier regions like Kerala and Telangana. In Kerala, the levels increased from 16.1% to 19.7%, and in Telangana, they increased from 28.5% to 31.8% (1✔ ✔Trusted Source
National Family Health Survey (NFHS-5)
Go to source,3✔ ✔Trusted Source
What has NFHS-5 revealed about malnutrition in India?
Go to source).

Stunting and Background Characteristics
- The prevalence of undernutrition is almost the same among girls and boys, although girls are slightly less well nourished than boys on all three measures.
- The prevalence of stunting increases with a child’s age from 6-8 months through 6-23 months, and it decreases slightly thereafter.
- Over two-fifths (44%) of children who were reported to be very small at birth are stunted, compared with 35 percent of children who were of average size or larger.
- Children born to thin mothers (BMI less than 18.5 kg/m2 ) are more likely to be stunted, wasted, and underweight than children born to mothers with a normal BMI or children whose mothers are overweight/obese.
- Forty-six percent of children born to mothers with no schooling are stunted, compared with 26 percent of children born to mothers with 12 or more years of schooling. The corresponding proportions of underweight children are 42 and 23 percent, respectively.
- The prevalence of stunting decreases steadily with an increase in wealth quintiles, from 46 percent of children in households in the lowest wealth quintile to 23 percent of children in households in the highest wealth quintile.

NFHS-5 – Nutrition Measurement Indicators for Children
Nutritional imbalance is measured by the indicators stunting, wasting, overweight, and underweight; this imbalance leads to either malnutrition or overweight.Chronic or recurring undernutrition throughout pregnancy, early childhood, and adolescence causes stunting. Children that are stunted may never grow to their fullest physical and intellectual potential.
Wasting is a potentially fatal condition brought on by inadequate nutrient intake and/or illness. Wasting is characterized by a rapid decline in nutritional status over a brief period of time. The cause of nearly half of all deaths in children under the age of five is undernutrition (2✔ ✔Trusted Source
Child Nutrition
Go to source).
Defining the Nutrition Measurement Indicators for Children
Stunting (assessed via height-for-age):
Height-for-age is a measure of linear growth retardation and cumulative growth deficits. Children whose height-for-age Z-score is below minus two standard deviations (-2 SD) from the median of the reference population are considered short for their age (stunted), or chronically undernourished. Children who are below minus three standard deviations (-3 SD) are considered severely stunted. Sample: Children under age five years.Wasting (assessed via weight-for-height):
Weight-for-height index measures body mass in relation to body height or length and describes current nutritional status. Children whose Z-score is below minus two standard deviations (-2 SD) from the median of the reference population are considered thin (wasted), or acutely undernourished. Children whose weight-for-height Z-score is below minus three standard deviations (-3 SD) from the median of the reference population are considered severely wasted. Sample: Children under age five years.Underweight (assessed via weight-for-age):
Weight-for-age is a composite index of height-for-age and weight-for-height. It takes into account both acute and chronic undernutrition. Children whose weight-for-age Z-score is below minus two standard deviations (-2 SD) from the median of the reference population are classified as underweight. Children whose weight-for-age Z-score is below minus three standard deviations (-3 SD) from the median are considered severely underweight. Sample: Children under age five years 375.Overweight children:
Children whose weight-for-height Z-score is more than 2 standard deviations (+2 SD) above the median of the reference population are considered overweight. Sample: Children under age five.How Does India Compare Against the Other Countries (Global Nutrition Report 2018)
According to the Global Nutrition Report 2018, India tops the list of nations with 46.6 million stunted children, followed by Nigeria (13.9 million) and Pakistan (10.7 million).Stunting can overall affect India’s human capital, poverty, and equity. Children with stunting tend to get less opportunities in life and the World Bank says, “A 1% loss in adult height due to childhood stunting is associated with a 1.4 percent loss in economic productivity.”
India is the country with the most wasted children (25.5 million), followed by Nigeria (3.4 million) and Indonesia (3.3 million).
Additionally, India is one of the nations with more than a million overweight kids. China, Indonesia, Egypt, US, Brazil, and Pakistan round out the list of other countries.
More over a fifth of youngsters in four nations - Ukraine, Albania, Libya, and Montenegro - are overweight.
In its effort to "eliminate all forms of malnutrition by 2030 for children under 5," India has not made as much progress as it could have.
The fundamental nutritional deficiency among children should be viewed as a sign of significant concern by policymakers without which the nutritional indicators will not improve quickly (4✔ ✔Trusted Source
Worrying trends in nutrition indicators in NFHS-5 data
Go to source).
What are the Government Initiatives to Improve Malnutrition
The Government has given the problem of malnutrition top priority and is implementing a number of programmes like the Pradhan Mantri Matru Vandana Yojana (PMMVY) under the umbrella of Integrated Child Development Services (ICDS) Scheme as direct targeted interventions to address the issue of malnutrition among children.The government has established ‘Nutrition Rehabilitation Centers’ under the Ministry of Health and Family Welfare, where children with severe acute malnutrition are treated (5✔ ✔Trusted Source
Malnutrition among Children
Go to source).
The National Nutrition Mission or POSHAN Abhiyaan that was launched in 2018 by the Prime Minister wishes to address the problem in a mission-mode.
What can be Done to Improve India’s Nutritional Status?
- Indian Government needs to review the nutrition programmes on a regular basis.
- The Integrated Child Development Services (ICDS), which play a main role in child nutrition needs to be evaluated.
- Better coordination among Ministries to tackle the problem of malnutrition is essential.
- Investing more on Social Welfare Programmes like mid-day meals and provide Supplementary nutrition to reduce the food gap.
- Source of food to the poor has to be made easily available.
- National Family Health Survey (NFHS-5) - (http://rchiips.org/nfhs/NFHS-5Reports/NFHS-5_India_Report.pdf)
- Child Nutrition - (https://data.unicef.org/topic/nutrition/child-nutrition/)
- What has NFHS-5 revealed about malnutrition in India? - (https://www.smilefoundationindia.org/blog/what-has-nfhs-5-revealed-about-malnutrition-in-india/)
- Worrying trends in nutrition indicators in NFHS-5 data - (https://indianexpress.com/article/opinion/columns/worrying-trends-nutrition-indicators-nfhs-5-data-7710473/)
- Malnutrition among Children - (https://pib.gov.in/PressReleasePage.aspx?PRID=1806601)
Source-Medindia


