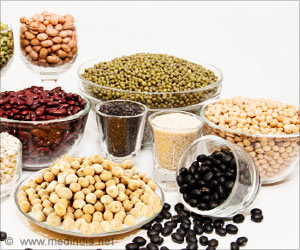
New nutrient profiling tools show that starchy vegetables have similar nutritional value as non-starchy vegetables and whole fruits.

Starchy Versus Non-Starchy Vegetables
Whole grains, legumes, non-starchy vegetables, and fresh fruit are typically considered to be higher quality carbohydrate foods, yet starchy vegetables, including white potatoes, are typically categorized in nutrition studies with sweets, candy, and soda, when researchers assess subjects’ food intake and associations with health outcomes.‘The study shows that all vegetables should remain together when it comes to both research and dietary guidance.’


This new study used five separate indices to assess carbohydrate quality to determine if this categorization of starchy vegetables is an accurate reflection of the foods’ nutritional value.Four of those carbohydrate quality indices (CQIs), based on carbohydrate to fiber and sugar ratios, had been developed and validated in 2021 by researchers at Tufts University. The fifth index, the new carbohydrate food quality scoring system (CFQS-4) recently developed by scientists working with the Quality Carbohydrate Coalition, also incorporated potassium and sodium. All five indices had been previously published.
The new study screened more than 2,400 carbohydrate-containing foods for carbohydrate quality. Recognizing that carbohydrates are present in a great variety of plant-based foods, the study expanded the range of food groups to include refined and whole grains, snacks and sweets, but also starchy and non-starchy vegetables, legumes and whole fruit. Starchy vegetables had not been tested before using the new carbohydrate quality metrics.
“Starchy vegetables are often not even viewed as vegetables and are routinely removed from high-quality food categories in nutrition research. That view is now challenged by the new nutrient profiling methods” said lead author Adam Drewnowski, PhD, researcher at the Center for Public Health Nutrition at the University of Washington.
“Now that we have formal measures of carbohydrate quality that we can agree on, it is time to put starchy vegetables back where they belong. There is no need to demonize ‘bad’ vegetables when the American diet could do with more produce of all kinds.”
Advertisement
The four CQIs and the CFQS-4 had been published before but had not been applied to evaluating carbohydrate quality of legumes, vegetables and fruit. The five indices were based on specific rations of carbohydrate, fiber, free sugar, potassium and sodium. Whereas potassium is under-consumed, sodium is consumed to excess. Both nutrients are recognized as ‘nutrients of public health concern’ in the Dietary Guidelines for Americans.
Advertisement
Based on the more comprehensive CFQS-4 model, which also accounts for foods’ potassium and sodium content,
starchy vegetables scored most closely to non-starchy vegetables and fruit versus sweets and soda.
“I hope that this simple application of existing carbohydrate quality metrics to a wide spectrum of carb-containing foods will show that starchy vegetables belong with the high-quality carbohydrate foods” said Drewnowski. “Our application of other nutrient profiling has previously shown that potatoes and beans led the pack in terms of nutrients per penny. This latest demonstration clearly shows that all vegetables should remain together when it comes to both research and dietary guidance.”
Study Design, Strengths, and Limitations
More than 2,400 carbohydrate foods in the USDA Food and Nutrient Database for Dietary Studies were evaluated using four previously published CQIs, and one more recently created carbohydrate food quality scoring system (CFQS-4).Specifically, the various CQI composites were:
- 10:1 Carbohydrate-to-Fiber model: at least 1 gram of fiber for every 10 grams of carbohydrate
- 10:1:1 Carbohydrate-to-Fiber-to-Free Sugars model: at least 1 gram of fiber and no more than 1 gram of free sugar for every 10 grams of carbohydrate
- 10:1:2 Carbohydrate-to-Fiber-to-Free Sugars model: at least 1 gram of fiber and no more than 2 grams of free sugar for every 10 grams of carbohydrate
- 10:1|2:1 Carbohydrate-to-Fiber and Sugar-to-Fiber model: at least 1 gram of fiber for every 10 grams of carbohydrate and fewer than 2 grams of sugar per 1 gram of fiber
- The CFQS-4 model builds upon previous 10:1 and 10:1:1 ratios for fiber and free sugars relative to carbohydrate, but also assesses sodium (an over-consumed nutrient of concern) and potassium content (a shortfall nutrient of concern) according to the Dietary Guidelines for Americans.
This study included a large, comprehensive data set using multiple nutrient profiling models. Further research to build upon these models, however, should continue to incorporate other vitamins and minerals in food quality assessments. Nonetheless, this study aligns with a broader, evolving body of literature showcasing the multi-dimensionality of carbohydrate foods and their role in human health.
As Dr. Drewnowski explained, “Current efforts to inform dietary guidelines and regulatory frameworks would benefit from modern, comprehensive tools to define and assess carbohydrate food quality.”
Source-Eurekalert


